Surface Roughness Measurement: Tools and Results
The same surface measured twice can give two different results - and both can be "correct" if they differ in sampling length, filter or the direction the stylus travels. This guide walks through roughness measurement from the metrology side: which instruments are available, how to set the sampling length and filter, what exactly a profilometer calculates, how , and differ, and how to judge a result against the drawing requirement.
Roughness and profile measurement: where to start
Every roughness measurement starts with the question of what exactly we want to measure. A machined surface is not smooth: it consists of irregularities at different scales - fine tool marks, longer waves from vibration and form deviations of the whole part. Standards describe this as surface texture and split it into three components: roughness, waviness and form.
A measured profile always contains all three at once; only filtering separates the roughness profile from which the parameters are calculated.
That is why assessing surface roughness always involves four steps: measuring the profile, filtering, calculating the parameters according to the standard and comparing them with the requirement. Only the full sequence produces a surface characterisation that can be compared between departments and suppliers. Skipping any step - measuring with the wrong filter, for example - gives a number that looks credible but does not correspond to what the designer specified.
Surface roughness and surface texture
Surface roughness comes mainly from the machining process: tool geometry, feed, vibration and material. In turning, the theoretical profile height grows with the square of the feed and falls with the nose radius, as we explain in our guide to feed rate. What the parameters themselves mean and which values are typical for turning, milling and grinding is covered in a separate article on surface roughness. Here we focus on how those numbers are produced.
Types of surface roughness and profile parameters
Surface roughness parameters fall into several families: the standards define dozens of them, but only a few ever appear on drawings. ISO 4287 and its successor ISO 21920-2 group them into height (amplitude) parameters, spacing parameters, hybrid parameters and material ratio parameters.
In shop practice roughness is also classified by its origin: kinematic roughness (regular feed marks), roughness from vibration and built-up edge (irregular) and roughness caused by the material itself, such as tear-outs in cast iron. The type matters because it determines which parameter describes the surface best: with regular marks the roughness height follows the feed and can be predicted; with irregular marks it has to be measured.
Roughness Ra and roughness Rz
The basic parameter is - the arithmetic mean of the absolute profile ordinates over the sampling length:
where:
- - deviation of the roughness profile from the mean line [µm],
- - sampling length [mm].
is stable and repeatable, but it averages out individual scratches: two profiles of completely different shape can have identical . That is why it is often accompanied by (formerly called RMS) - the root mean square of the ordinates, more sensitive to individual peaks - and by height parameters.
is the maximum height of the profile within a sampling length, i.e. the sum of the highest peak and the deepest valley: . The instrument determines it on each of the five sampling lengths separately and reports the mean: . describes the peaks alone (highest peak above the mean line) and the valleys (deepest valley). is the total height of the profile, calculated not over a sampling length but over the whole evaluation length - which is why always.
Rmax, Rz1max, RzJIS and Rpm: parameters from other standards
Drawings and reports also show parameters beyond the basic pair - and they cause most of the misunderstandings. is the single profile height on the i-th sampling length, from which is built. is the largest of the five values, i.e. the maximum profile height in the whole measurement; it is used where a single deep scratch matters more than the average. is its equivalent from older DIN and ASME standards - in practice the same idea. When an old drawing specifies , the safest approach is to measure and note this in the report.
is the so-called ten-point height according to the Japanese standard JIS B 0601: the mean of the five highest peaks and five deepest valleys. Until 1997 this was also how ISO defined , so old drawings and some older instruments give an "Rz" that is actually . For the same surface usually comes out slightly lower than ISO . (mean peak height over five sampling lengths) appears in American standards (ASME B46.1) and older DIN standards; together with it shows whether the profile height comes from protruding peaks or deep valleys.
Functional parameters: Rk, Rpk, Rvk and Rmr
For sliding surfaces heights alone are not enough. is the material ratio at a given depth - the percentage of the profile length at which the section passes through material. From the material ratio curve (Abbott-Firestone curve) ISO 13565-2 derives three parameters: (core roughness depth), (reduced peak height - peaks that wear off quickly) and (reduced valley depth - valleys that retain oil). These parameters require a special filter (ISO 13565-1) that does not distort deep valleys. The classic example is a plateau-honed cylinder bore: small , large - and an that cannot be inferred from .
Measuring surface roughness: sampling length and filters
The most important setting in the whole measurement is the length. The standard distinguishes three: the sampling length (equal to the filter cut-off wavelength ), the evaluation length over which parameters are calculated, and the traverse length , which also includes run-up and over-travel. By default consists of five sampling lengths: .
The sampling length decides what the instrument treats as roughness and what as waviness. The Gaussian filter (ISO 16610-21) transmits 50% of the amplitude of a wave of length : shorter waves go into the roughness profile, longer ones into waviness. Too short a cut-off truncates part of the roughness and understates the result; too long a cut-off pulls waviness into roughness and overstates it. A second filter, , removes the shortest waves that the stylus cannot resolve anyway; for mm it is typically 2.5 µm.
Roughness table: choosing the sampling length
Sampling length selection according to ISO 4288 (rules carried over into ISO 21920-3) for non-periodic profiles, such as ground surfaces:
| Expected [µm] | Expected [µm] | Sampling length [mm] | Evaluation length [mm] |
|---|---|---|---|
| 0.006-0.02 | 0.025-0.1 | 0.08 | 0.4 |
| 0.02-0.1 | 0.1-0.5 | 0.25 | 1.25 |
| 0.1-2 | 0.5-10 | 0.8 | 4 |
| 2-10 | 10-50 | 2.5 | 12.5 |
| 10-80 | 50-200 | 8 | 40 |
For periodic profiles (turning, milling) the sampling length follows the spacing of the marks, described by (mean width of profile elements): for from 0.13 to 0.4 mm the sampling length is 0.8 mm, from 0.4 to 1.3 mm it is 2.5 mm. The procedure is iterative: a first measurement with an estimated cut-off, reading the result, correcting the length and a final measurement. This table is the most frequently skipped step in the shop - and most disputes about results start with a wrongly chosen filter.
Roughness classes and the measured result
Roughness classes N1 to N12 (old ISO 1302 designations) are essentially ranges of from 0.025 to 50 µm. Measurement does not change them: the instrument always gives a number, and the class is just a way of writing it on the drawing. How to read classes and complete roughness callouts is explained in our guide to surface roughness symbols. From the measurement point of view one thing matters: class N6 ( 0.8 µm) requires a 0.8 mm sampling length, class N3 ( 0.1 µm) only 0.25 mm. The class also affects part cost: every step down means slower cutting parameters and longer inspection, which shows immediately in an instant CNC quote.
Optical and contact profilometers
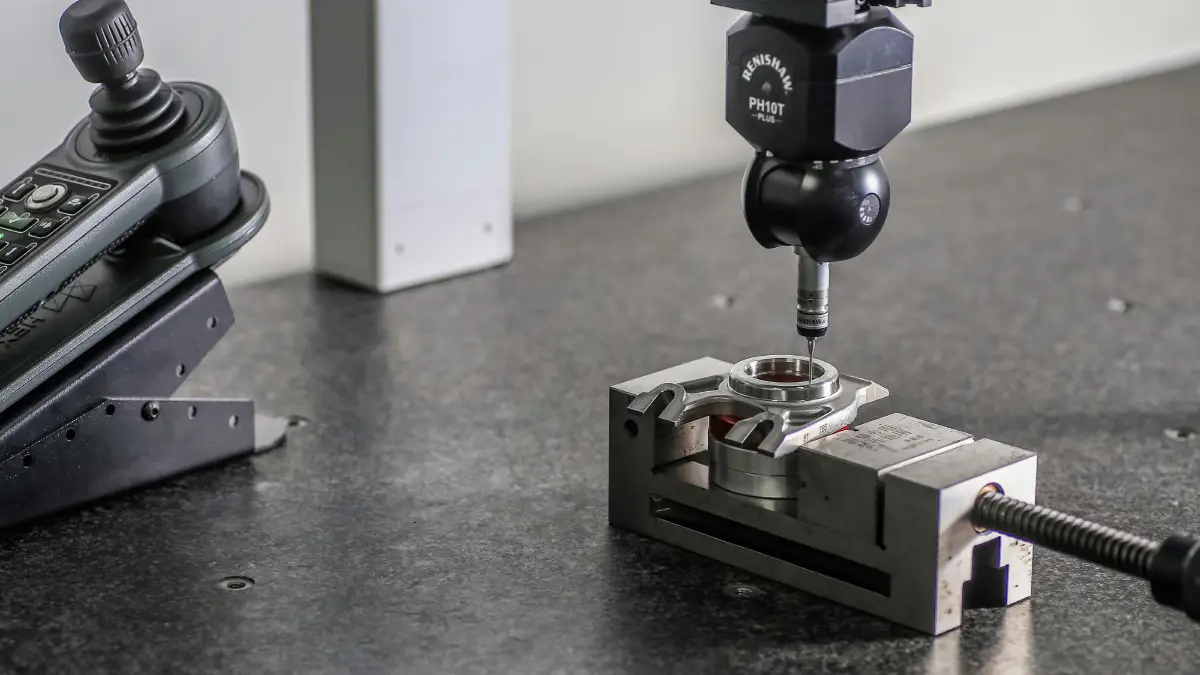
There are two families of instruments. A contact profilometer drags a diamond stylus across the surface and records its vertical movement - the reference method for most profile standards. Optical profilometers measure without contact: light reflected from the surface is turned into a height map, usually directly in 3D.
The choice depends on the material, the required resolution, the part geometry and whether the result has to be comparable with a drawing requirement written in profile parameters.
Profile roughness measurement with a stylus instrument
According to ISO 3274 a stylus instrument has a tip radius of 2 µm (also 5 or 10 µm) and a cone angle of 60° or 90°; the measuring force is very small - nominally 0.75 mN for a 2 µm tip. Profile measurements are taken perpendicular to the machining marks, where the irregularities are largest: along the generatrix of a turned shaft, across the marks of a face-milled plane. Measurements are always repeated at several points on the part, because one trace is only a sample - and the number, position and direction of the traces belong in the inspection plan.
An important choice is the stylus guidance: a skid pickup rests on the surface and filters waviness itself (fast and cheap, but with a risk of distortion), while a skidless pickup moves against a reference datum and records the full profile - only then can roughness, waviness and form be analysed from one measurement. Stylus instruments have limits too: the tip cannot enter gaps narrower than its radius, and it can scratch soft materials such as polished aluminium or plastics - there an optical measurement is the better choice.
Atomic force microscopes
At the other end of the scale are atomic force microscopes (AFM). A tip with a radius of around 10 nm scans an area usually no larger than 100 × 100 µm, with a vertical resolution in fractions of a nanometre. It is a tool for optics, semiconductors and thin films, where is expressed in nanometres - in machining it is rarely needed, mainly for research or for lapped and polished surfaces.
How to measure roughness in the shop and in the lab
In practice roughness is measured at three levels of accuracy: with comparison specimens at the machine, with a portable tester, and with a stationary profilometer or optical instrument in the inspection room. The simplest is comparison with specimens: a set of plates with known for turning, milling and grinding lets you judge a surface by eye and fingernail.
Such comparison specimens give an approximate assessment, most reliable from a few tenths to a dozen or so micrometres, and work well at the machine, but they do not replace measurement for functional tolerances. The second level is a portable roughness tester: a measurement takes seconds and the results (usually , , , ) appear on the display immediately. At the machine, roughness is measured mainly to catch a worn edge before a batch drifts out of tolerance. The third level is a stationary profilometer or optical instrument in the inspection room, with full profile analysis and a report.
In series inspection, roughness is typically measured on the first and last part of a shift and after every insert change. Whatever the level, a few rules apply. The surface must be clean - a film of coolant or a fingerprint changes the result. Position the part so the traverse is perpendicular to the machining marks, and check the instrument on a calibration standard before a series (ISO 5436-1 describes depth standards and roughness standards with known , among others). Finally, record the settings - , and filter type - without them the result cannot be repeated or compared.
What happens when the result is close to the limit? By default standards apply the 16% rule: the requirement is met if no more than 16% of the measured values exceed the limit. The ISO 4288 procedure is simple - if the first result does not exceed 70% of the limit, the surface conforms; otherwise further measurements are taken, up to twelve in total, of which at most two may exceed the limit. If the drawing says "max", the max rule applies: no measurement may exceed the requirement, and the maximum roughness becomes a hard limit.
Roughness measurement results: reading the report
A report is read by comparing each parameter with the drawing requirement and the acceptance rule: is judged with the 16% rule, an requirement is compared with , and the ratios of to , to and to show which process and which profile shape lie behind the numbers.
A profilometer report is a profile chart and a list of numbers. Take an example: a ground shaft journal with a requirement of 0.8 µm, measured with mm over 4 mm. The calculated parameters might look like this (example values):
| Parameter | Result [µm] | What it tells you |
|---|---|---|
| 0.42 | arithmetic mean deviation from the mean line | |
| 0.53 | root mean square deviation of the profile | |
| 2.9 | maximum profile height, mean of five sampling lengths | |
| 3.6 | largest profile height in the whole measurement | |
| 1.1 | mean peak height | |
| 1.8 | mean valley depth | |
| 3.9 | total profile height over | |
| / / | 1.2 / 0.3 / 0.7 | core, peaks that wear off, oil-retaining valleys |
How to read it? = 0.42 µm meets the requirement with a wide margin - below 70% of the limit, so under the 16% rule one measurement is enough. If the drawing required , we would compare the requirement with 3.6 µm, i.e. . In an ASME report the value would be called - the mean of the highest peaks over five sampling lengths. The to ratio is about 7 here, which is typical of grinding. is a quarter higher than , so the ordinate distribution is close to normal. larger than means the profile height comes from valleys rather than peaks - good news for a journal under a shaft seal. Parameter evaluation always ends in a summary like this, not a single number.
Surface roughness testing and 3D surface analysis
Laboratory roughness testing increasingly includes, alongside classic profile parameters, measurement of a whole area and areal parameters according to ISO 25178 (, , and others). A 3D map is essentially many parallel traces: the surface profile recorded densely in both directions.
A profile is only one line. A 3D map reveals things a profile cannot show: the directionality of marks, isolated pits, the distribution of peaks. Three optical techniques are used: confocal microscopy, coherence scanning (white-light) interferometry and focus variation. Interferometry offers sub-nanometre vertical resolution on smooth surfaces, so it can measure roughness even on lapped parts; focus variation copes better with steep slopes and matt surfaces.
3D analysis has its price, though. Areal parameters () are not identical to profile parameters () and must not be compared directly with a drawing requirement specified as a profile parameter. Optical measurements are also sensitive to reflectivity: mirror-like and very dark surfaces can produce missing data or false spikes that have to be filtered out before parameters are calculated.
ZEISS solutions for roughness measurement
ZEISS solutions are a good example of how manufacturers combine both instrument families. The ZEISS ROTOS contact sensor mounts on a coordinate measuring machine: its rotating axes reach surfaces at different angles, and the roughness result goes into the same software (ZEISS CALYPSO) and report as the dimensions, without moving the part to a separate instrument. On the optical side, ZEISS offers confocal microscopes such as the LSM 900 Mat and Smartproof 5, with ZEISS ConfoMap software for topography analysis to profile and areal standards. It illustrates a general trend: roughness measurement is ceasing to be a separate lab operation and becoming part of measuring the whole part.
Frequently asked questions about roughness measurement
How can I measure roughness on a finished part without a lab?
With a portable contact tester: place it on the surface, set the sampling length (usually 0.8 mm) and read and . Measure across the machining marks, at several points, on a clean surface, and record the settings: , and the filter type. Comparison specimens are only good for an approximate assessment.
What does surface roughness after machining depend on?
Mainly on the feed and the tool nose radius, then on vibration, tool wear, built-up edge and material. In turning, the theoretical roughness height grows with the square of the feed and falls as the nose radius increases. Measurement shows the combined effect but not which factor dominates - that requires profile analysis.
Which errors should I avoid when measuring roughness?
The most common are a wrong sampling length (result understated or inflated by waviness), measuring along the marks instead of across them, a dirty surface, no check on a standard, and comparing from an old drawing with from a new instrument, although what the old drawing calls "Rz" may actually be .
Is Ra enough for surface analysis?
For series inspection, usually yes, because is stable and repeatable. For functional surfaces such as seals, bearings and cylinder bores, no: they need height parameters (, ) and functional ones (, , , ), because cannot tell peaks from valleys.
Which ZEISS solution to choose: contact sensor or optical microscope?
The ROTOS contact sensor measures the profile on a CMM together with the dimensions, so the result is directly comparable with a profile requirement on the drawing. Confocal microscopes measure without contact and in 3D, which gives a fuller surface analysis but requires a deliberate conversion to profile parameters.
Sources
- 1.S. Adamczak, "Pomiary geometryczne powierzchni. Zarys kształtu, falistość i chropowatość", WNT, 2008 (surface texture, stylus instruments, filtering)
- 2.D.J. Whitehouse, "Handbook of Surface and Nanometrology", 2nd ed., CRC Press, 2010 (profile parameters, AFM, optical methods)
- 3.R. Leach (ed.), "Optical Measurement of Surface Topography", Springer, 2011 (interferometry, confocal microscopy, focus variation)
- 4.P. Pawlus, "Topografia powierzchni: pomiar, analiza, oddziaływanie", Rzeszów University of Technology Publishing House, 2005 (Rk parameters and honed surfaces)
- 5.ISO 21920-2 and ISO 4287 (profile parameters), ISO 21920-3 and ISO 4288 (sampling lengths, 16% rule), ISO 3274 (stylus instruments), ISO 13565-2 (Rk, Rpk, Rvk), ISO 25178-2 (areal parameters), ISO 5436-1 (measurement standards), JIS B 0601 (RzJIS)
- 6.ZEISS Industrial Quality Solutions technical materials (ROTOS, LSM 900 Mat, Smartproof 5)
Read next
Automatic CNC machining quotes
Priced from the 3D model or the drawing, on your machines and your rates. You just approve it. 14 days free, no card.
Create a free account